Learning from Multiple Sources for Video Summarisation IJCV'15, ICCV'13
Introduction
Generating coherent synopsis for surveillance video stream remains a formidable challenge due to the ambiguity and uncertainty inherent to visual observations. In contrast to existing video synopsis approaches that rely on visual cues alone, we propose a novel multi-source synopsis framework capable of correlating visual data and independent non-visual auxiliary information to better describe and summarise subtle physical events in complex scenes. Specifically, our unsupervised framework is capable of seamlessly uncovering latent correlations among heterogeneous types of data sources, despite the non-trivial heteroscedasticity and dimensionality discrepancy problems. Additionally, the proposed model is robust to partial or missing non-visual information. We demonstrate the effectiveness of our framework on two crowded public surveillance datasets.
Contribution Highlights
- We show that coherent and meaningful multi-source based video synopsis can be constructed in an unsupervised manner by learning collectively from heterogeneous visual and non-visual sources. This is made possible by formulating a novel Constrained-Clustering Forest (CC-Forest) with a reformulated information gain function that seamlessly handles multi-heterogeneous data sources dissimilar in representation, distribution, and dimension.
- The proposed approach is novel in its ability to accommodate partial or completely missing non-visual sources.
- We demonstrate the usefulness of our framework through generating video synopsis enriched by plausible semantic explanation, providing structured event-based summarisation beyond object detection counts or key-frame feature statistics.
Citation
-
Learning from Multiple Sources for Video Summarisation
X. Zhu, C. C. Loy, S. Gong
International Journal of Computer Vision, in print, 2015 (IJCV)
[Preprint] -
Video Synopsis by Heterogeneous Multi-Source Correlation
X. Zhu, C. C. Loy, S. Gong
in Proceedings of IEEE International Conference on Computer Vision, 2013 (ICCV)
[PDF] [Poster]
Images
The proposed CC-Forest discovers latent correlations among heterogeneous visual and non-visual data sources, which can be both inaccurate and incomplete, for video synopsis of crowded public scenes.
Training steps for learning a multi-source synopsis model.
Structure-driven non-visual tag inference: (a) Channel an unseen clip x* into individual trees; (b) Estimate the nearest clusters of x* within the leaves it falls into: hollow circles denote clusters; (c) Compute the tag distributions by averaging tree-level predictions.
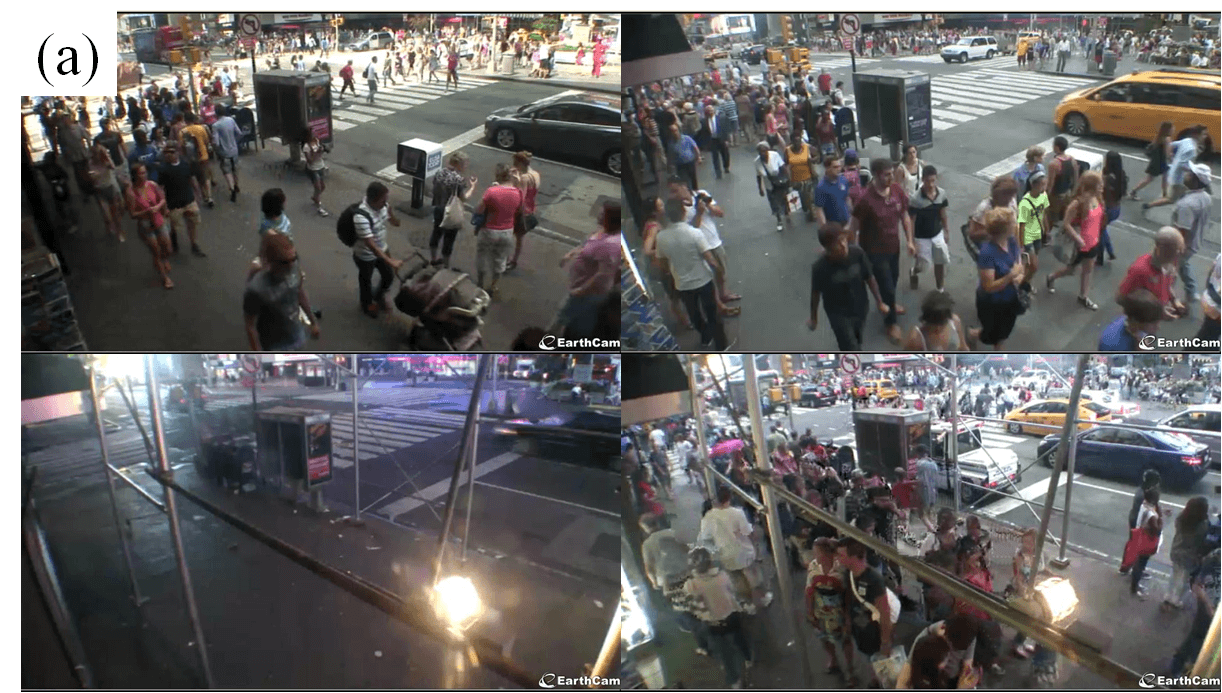
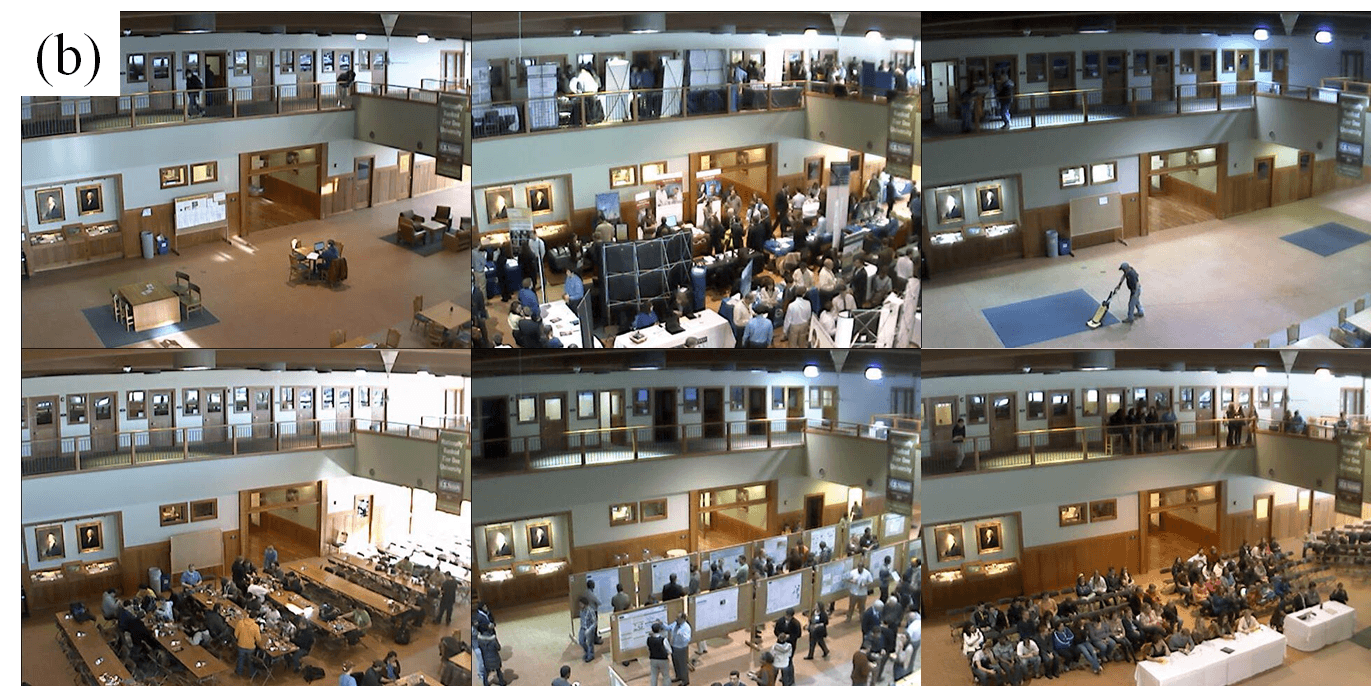
We conducted experiments on two datasets collected from publicly accessible webcams that feature an outdoor and an indoor scene respectively: (1) the TImes Square Intersection (TISI) dataset, and (2) the Educational Resource Centre (ERCe) dataset. There are a total of 7324 video clips spanning over 14 days in the TISI dataset, whilst a total of 13817 clips were collected across a period of two months in the ERCe dataset. Each clip has a duration of 20 seconds.
Qualitative comparison on cluster quality between different methods on the TISI dataset. A key frame of each video clip is shown. (X/Y) in the brackets - X refers to the number of clips with sunny weather as shown in the images in the first two columns. Y is the total number of clips in a cluster. The frames inside the red boxes refer to those inconsistent clips in a cluster.
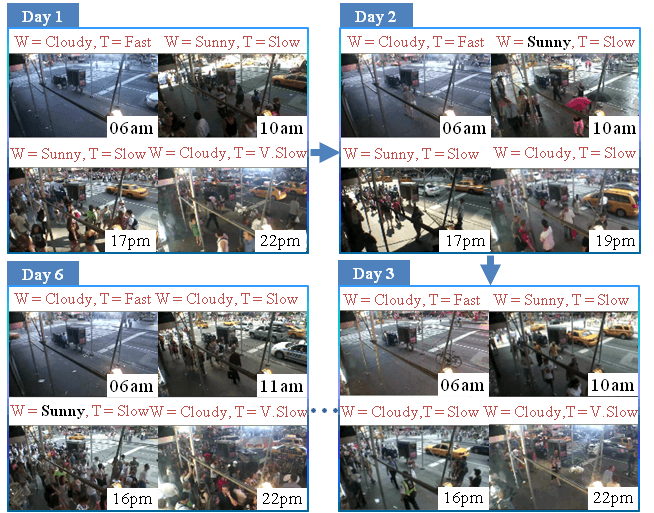
A synopsis with a multi-scale overview of weather+traffic changes over multiple days. Black bold prints = failure predictions.


